Available for Q2 2026 engagements · Polito + freelance
Geospatial systems for natural hazards,
Geospatial systems for natural hazards,
built as products.
I’m M. Daud Tasleem — a civil-engineer-turned-geospatial product engineer researching at Politecnico di Torino. I build WebGIS, SAR/InSAR, QGIS, GeoAI, and digital-twin systems for multi-hazard risk, urban heat, flood impact, and infrastructure resilience.
Multi-hazard risk
SAR / InSAR
GeoAI
Mapbox · Cesium
QGIS / PyQGIS
BIM · Digital twins

M. Daud Tasleem
Research Assistant · Polito · MSc Civil Eng (103/110)
Project reach · live globe
7 cities
TORINO · IT
45.07°N · 7.69°E
Research hub
Client delivery
01 The person
From civil engineer to geospatial researcher & builder.
I bridge academic rigor with product craft. Research at Politecnico di Torino feeds directly into the tools, plugins, and dashboards I ship.
Trusted by
- WHOWorld Health Organization
- PolitoPolitecnico di Torino
- DigiSkyESA InCubed partner
- NODESPNRR research grant
- MANAGE 5.0EU funded
- NUSTMilitary College of Engg.
- Upwork3-yr Top-Rated
I’m a civil engineer by training, a researcher at Politecnico di Torino, and a freelance geospatial product engineer with 550+ delivered projects.
My work focuses on translating natural-hazard science — flood, landslide, urban heat, seismic deformation — into operational spatial decision surfaces. I combine WebGIS, SAR/InSAR, QGIS, GeoAI, UAV inspection, and digital twins into one coherent toolkit.
On the research side I’ve published in Sustainability (MDPI), Scientific Reports (Nature), and Smart Cities. On the applied side, I’ve been a 3-year top-rated seller on Upwork, serving clients including the WHO.
550+Freelance projects
7Publications
110+Citations
3Funded research grants
02 The research
Funded work on natural hazards and resilience.
Six active and completed projects backed by MANAGE 5.0, NODES, and ESA InCubed — spanning multi-hazard analysis, urban heat, corridor GeoAI, and digital-twin resilience.
Oct 2023 – Current
Funded · MANAGE 5.0
GIS-BIM 5.0 Web Visualization Platform
Unified platform for dynamic 3D data display and real-time urban analysis. Uses ML, Web-BIM, GIS, IoT, and GeoAI for 3D+ visualization and natural-hazard decision support.
Jul – Sept 2023
Funded · ESA InCubed
PCA for Urban Heat Vulnerability Index
Led Urban Heat Island study bridging academic + commercial sectors. Acquired and pre-processed thermal camera data with meteorological corrections; ran PCA on adaptive-capacity indicators and implemented green-infrastructure recommendations.
Feb – Sept 2023
Funded · NODES
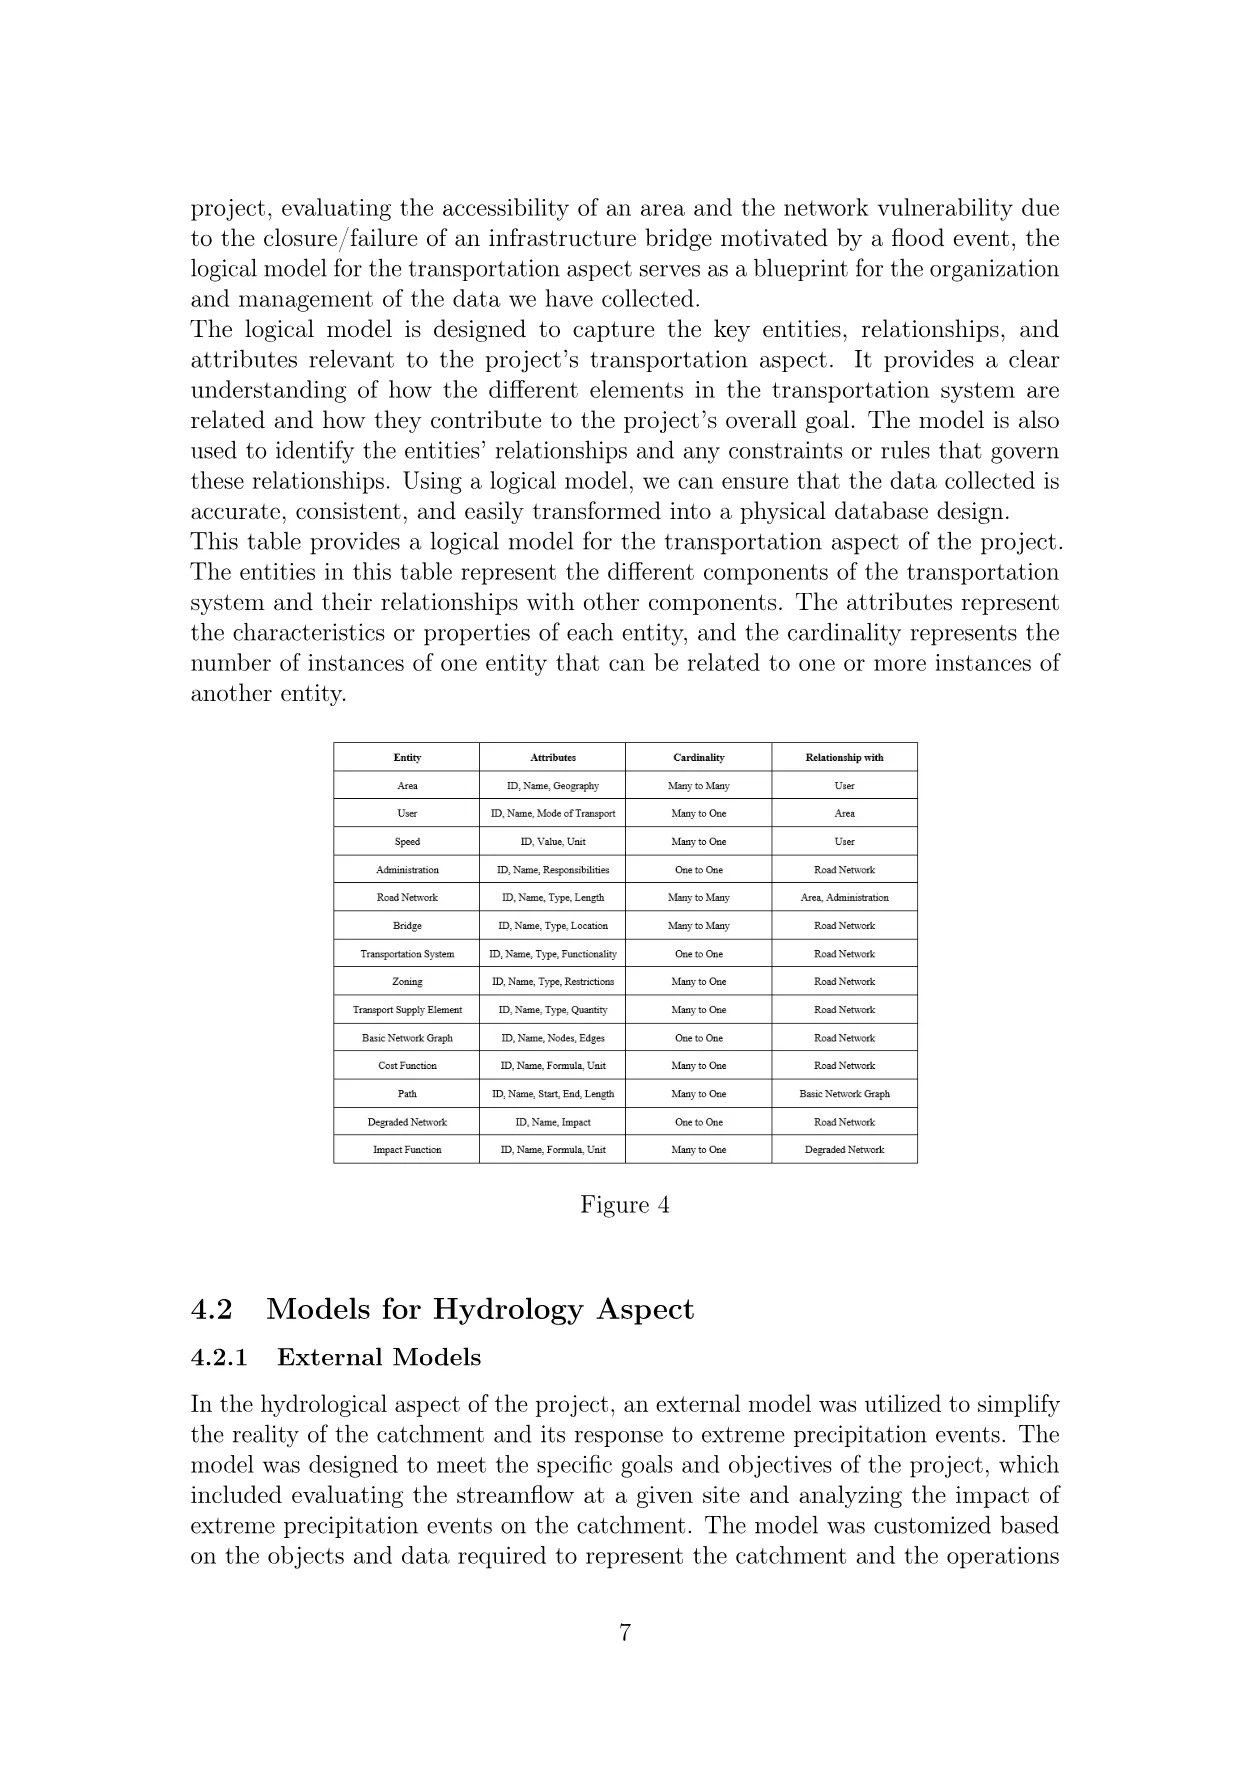
Multi-Hazard Landscape Digital Twin
Multi-hazard road-network analysis of Orco Valley with socio-economic indicators. Built a PostGIS database integrating 2D-3D open-source data and published in Q1 journal (Sustainability, MDPI).
Sept 2022 – Mar 2023
Sponsored Thesis
Corridor Mapping with Machine Learning
Pixel & object-based classification benchmark on 2D vs 2.5D datasets for airport corridors. Compared RF, SVM, DeepLabv3, SAM, and UNet — achieving 91% F1.
Aug – Oct 2022
Curricular Internship
Semi-Automatic Flat-Roof Extraction
QGIS plugin with a semi-automatic algorithm extracting green-roof / flat-roof data from dense urban ortho-mosaics — targeting urban-heat-island mitigation. Ground-truth accuracy: 92%.
Sept – Dec 2022
Fellowship
Giovanni Curioni’s 3D VR Museum
Immersive, interactive VR museum built in Unreal Engine 5. Cross-platform app providing access to high-quality 3D models of historical collections.
03 The papers
What’s been peer-reviewed.
Seven publications in Sustainability, Scientific Reports, and Smart Cities — 110+ citations, h-index 3, i10 3.
-
01
Sustainability · MDPI · 2024 · 45 citations
Comprehensive Analysis of the Use of Web-GIS for Natural Hazard Management: A Systematic Review
Published · Q1 Sustainability 16(10) Web-GIS Natural hazards -
02
Scientific Reports · Nature · 2024 · 35 citations
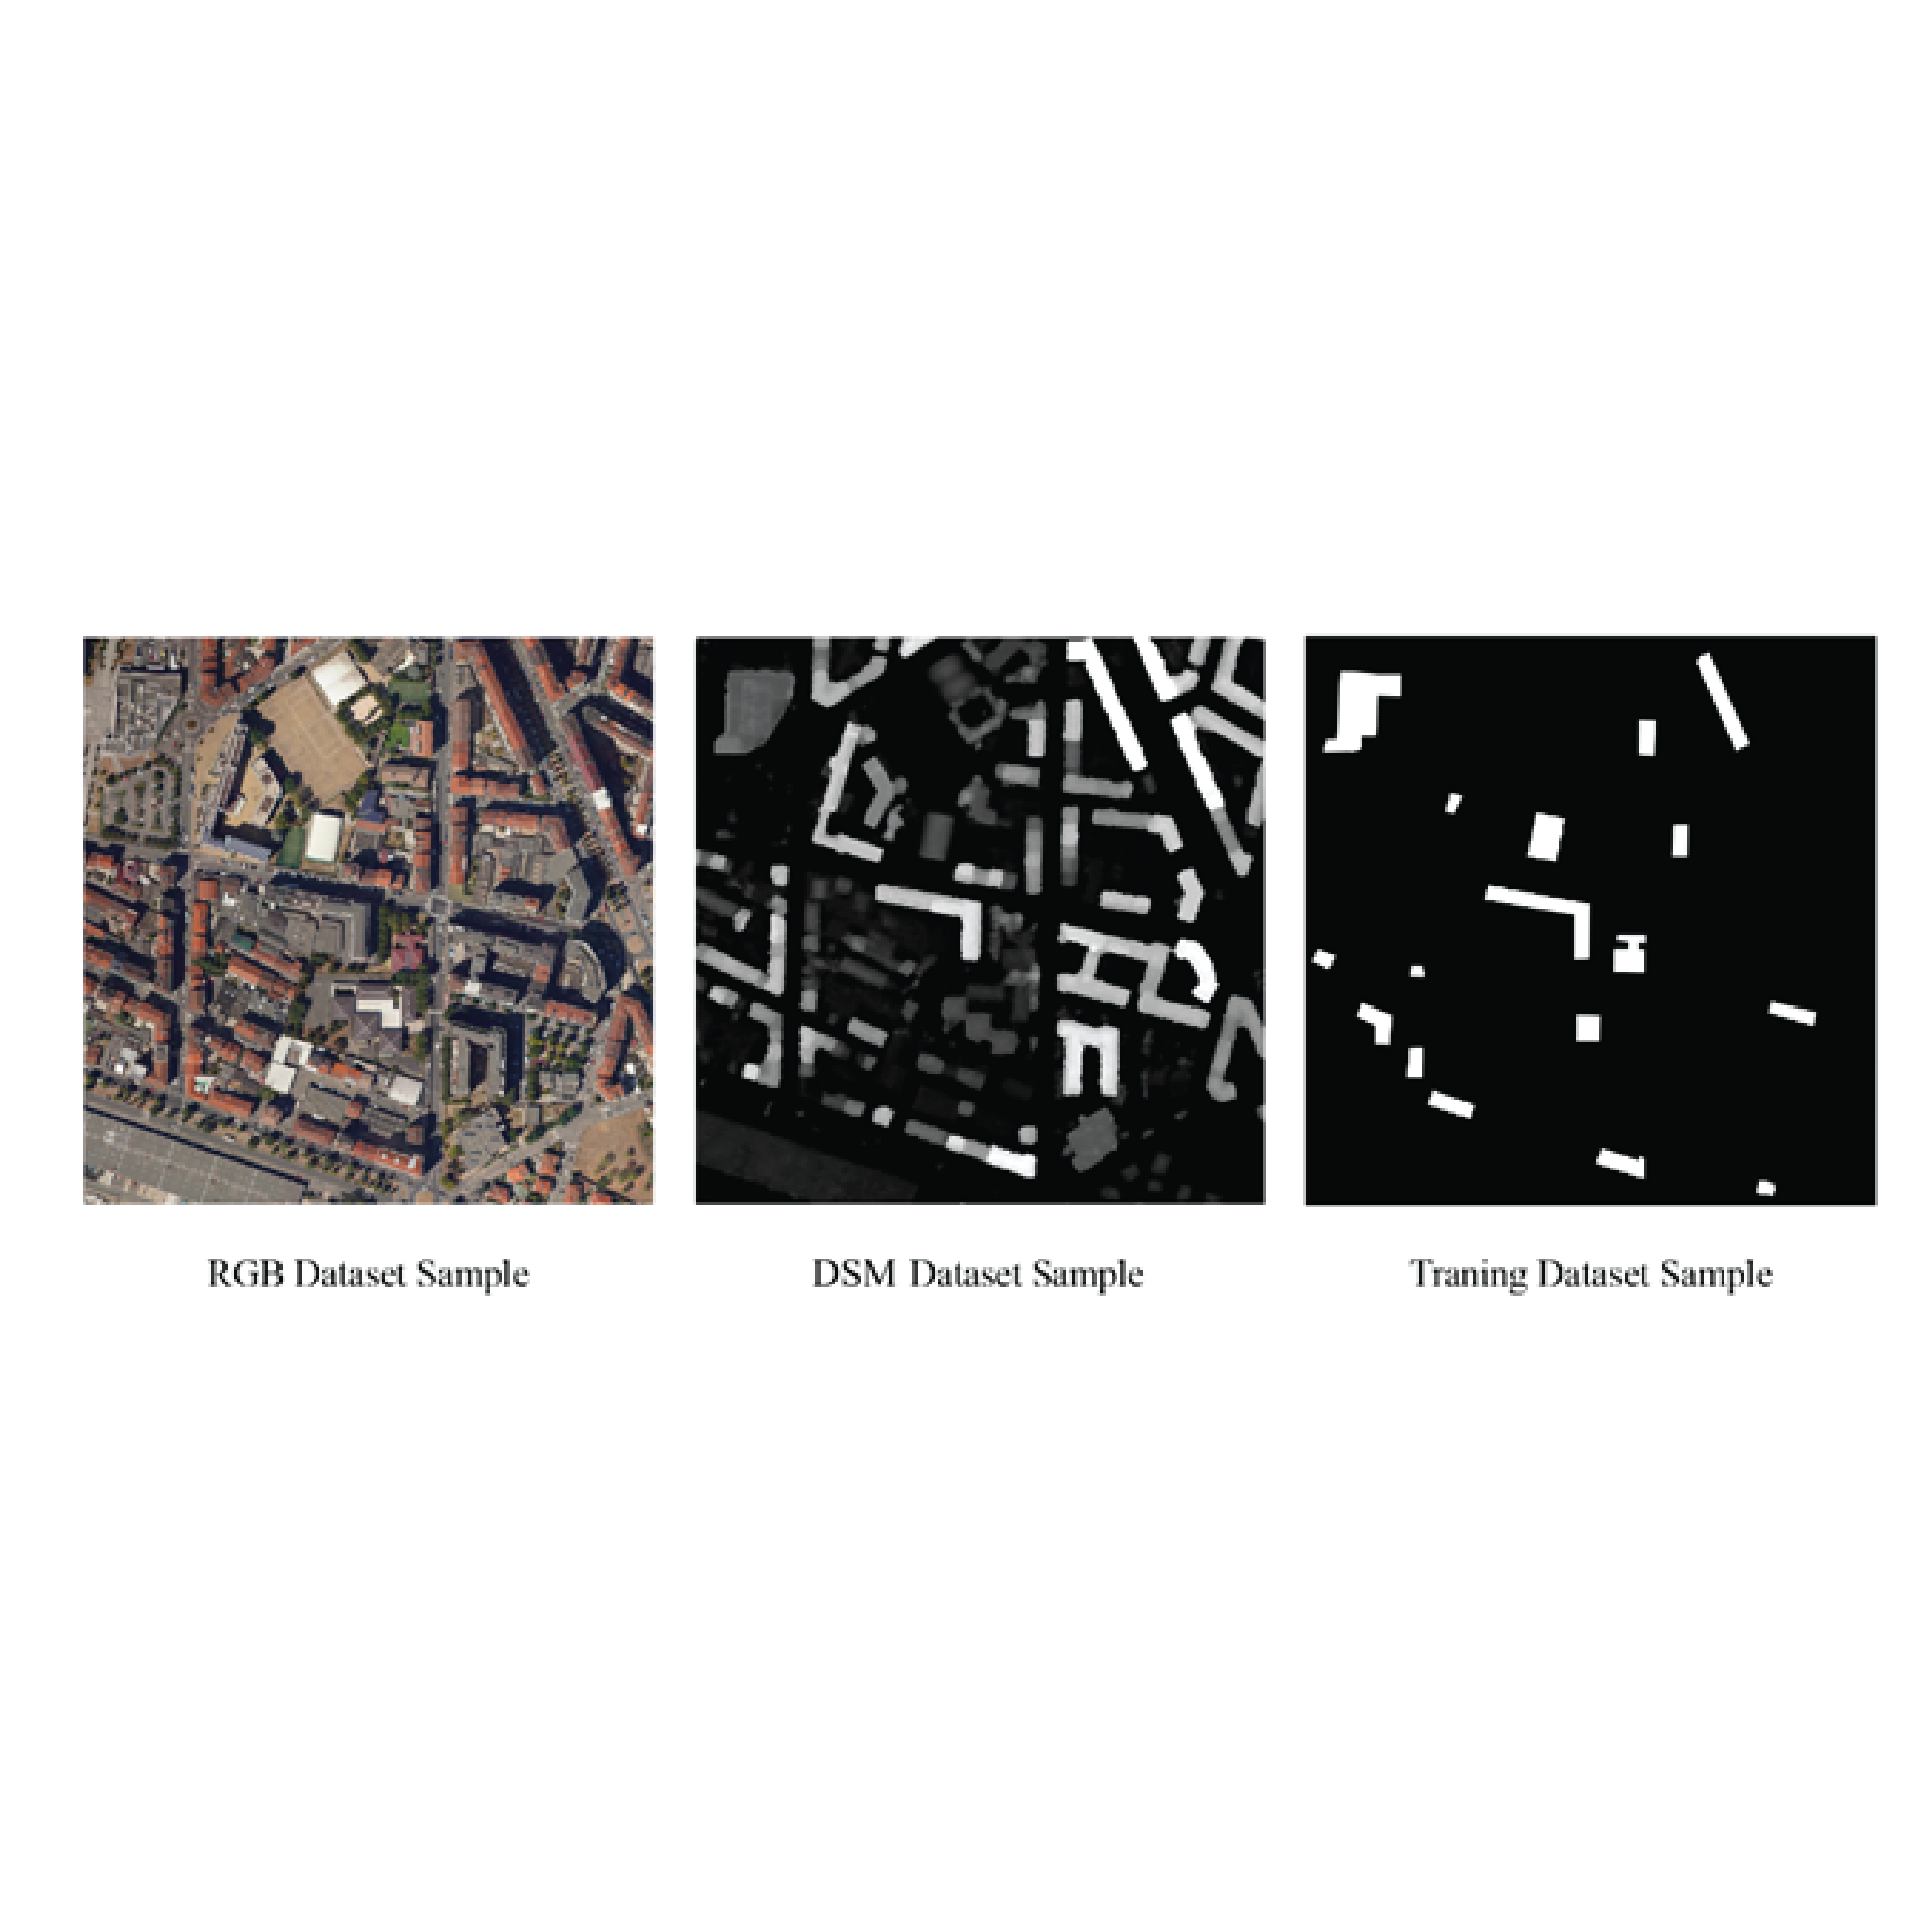
Revolutionizing Urban Mapping: Deep Learning and Data Fusion Strategies for Accurate Building Footprint Segmentation
Published · Nature Sci. Reports 14(1) Deep learning Data fusion -
03
Sustainability · MDPI · 2023 · 27 citations
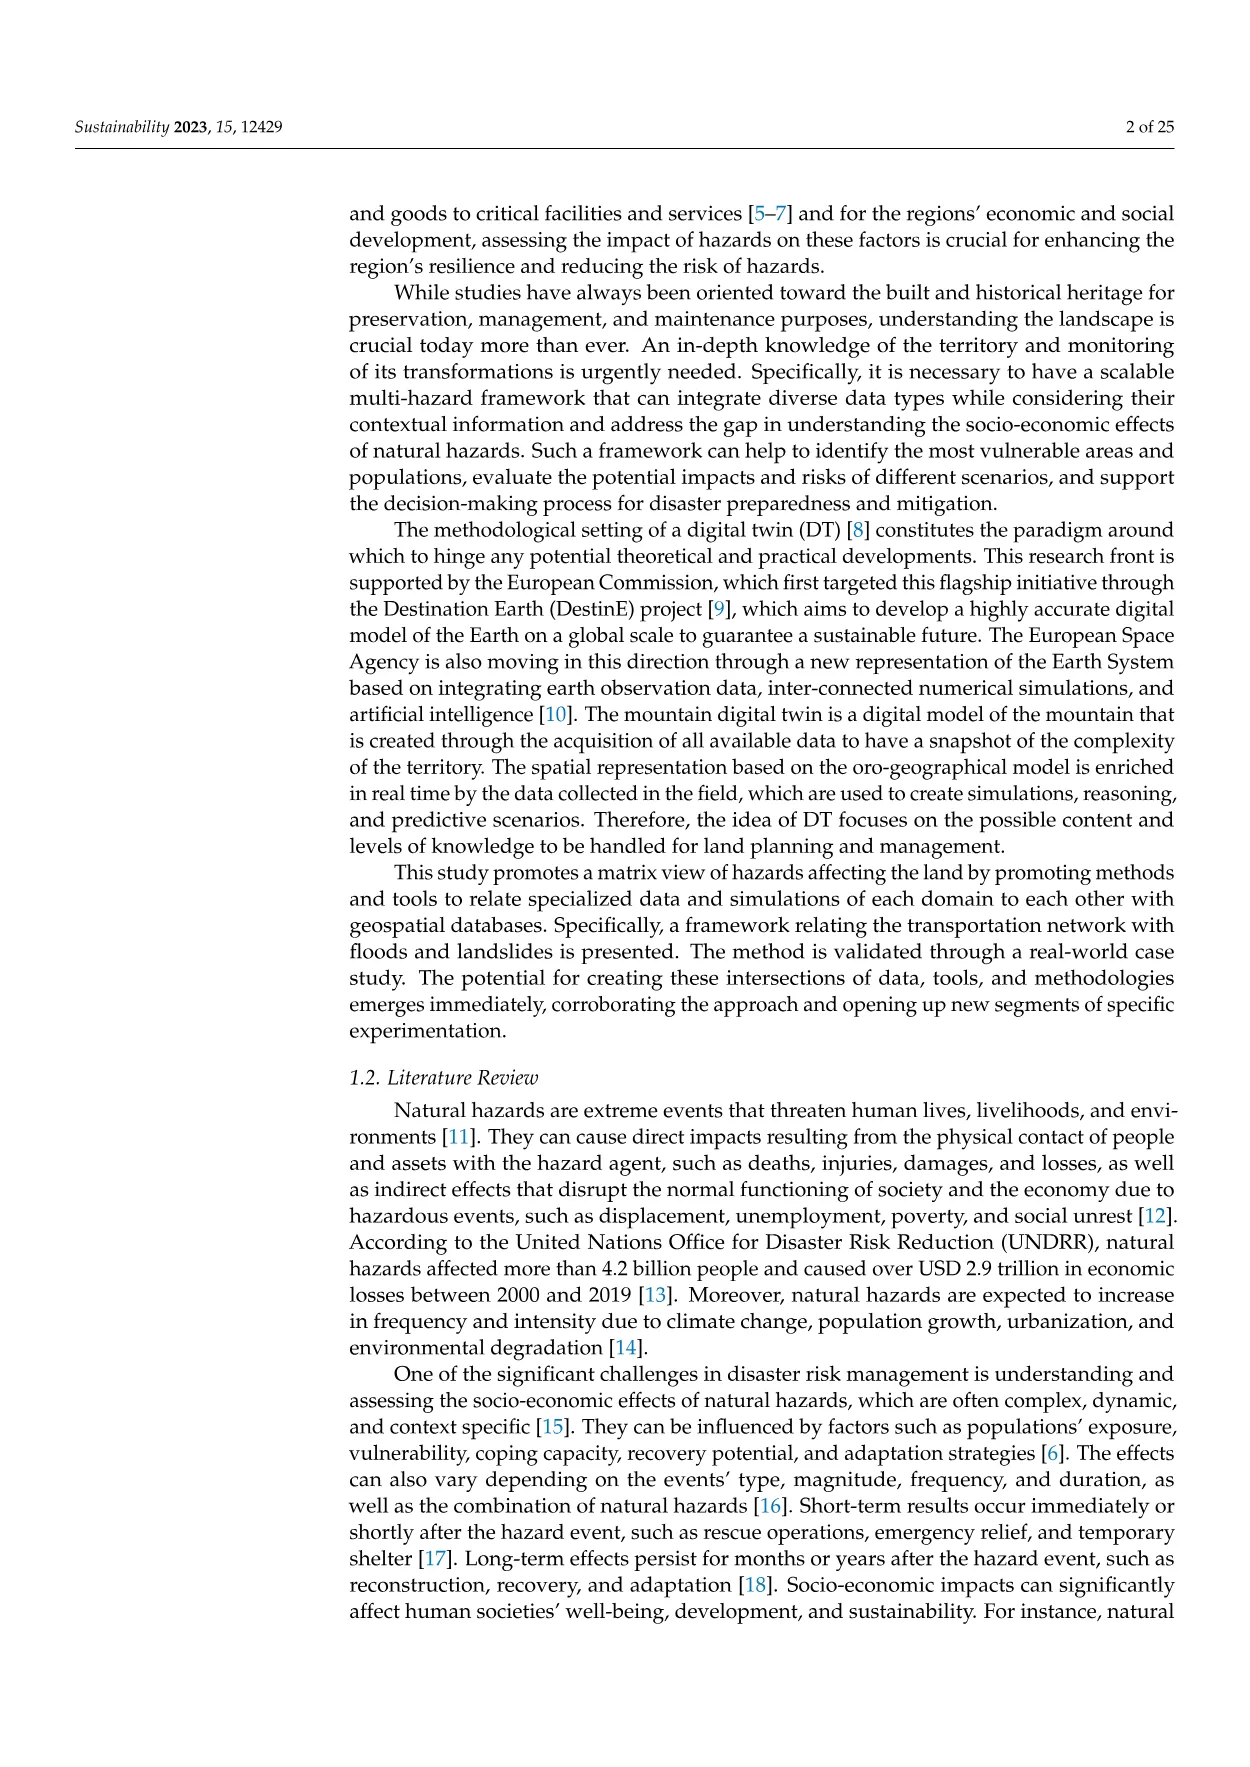
Enhancing Risk Analysis toward a Landscape Digital Twin Framework: A Multi-Hazard Approach in the Context of a Socio-Economic Perspective
Published · Q1 doi: 10.3390/su151612429 Multi-hazard Digital twin -
04
Smart Cities · MDPI · 2025 · 3 citations
Spatial Insights for Building Resilience: The Territorial Risk Management & Analysis Across Scale Framework
Published Smart Cities 8(1) TRMAAS Resilience -
05
Sustainability · MDPI · 2026
Rethinking Education on Critical Infrastructure Resilience and Risk Management
Published Sustainability 18(6) Critical infrastructure Education -
06
geodaysIT · Bari · 2023
The Use of Open-Source Machine Learning Techniques for Urban Features Extraction
Presented Conference ML Urban features -
07
Politecnico di Torino · 2023 · Master Thesis
Corridor Mapping Processing Using the Machine Learning Approach
Thesis 91% F1 DeepLabv3 · UNet · SAM
04 The lab
Click through the work like a product.
Pick a system — the preview, problem, outcome, and stack update live.
 Shipped surface
Rail monitoring / Digital twin
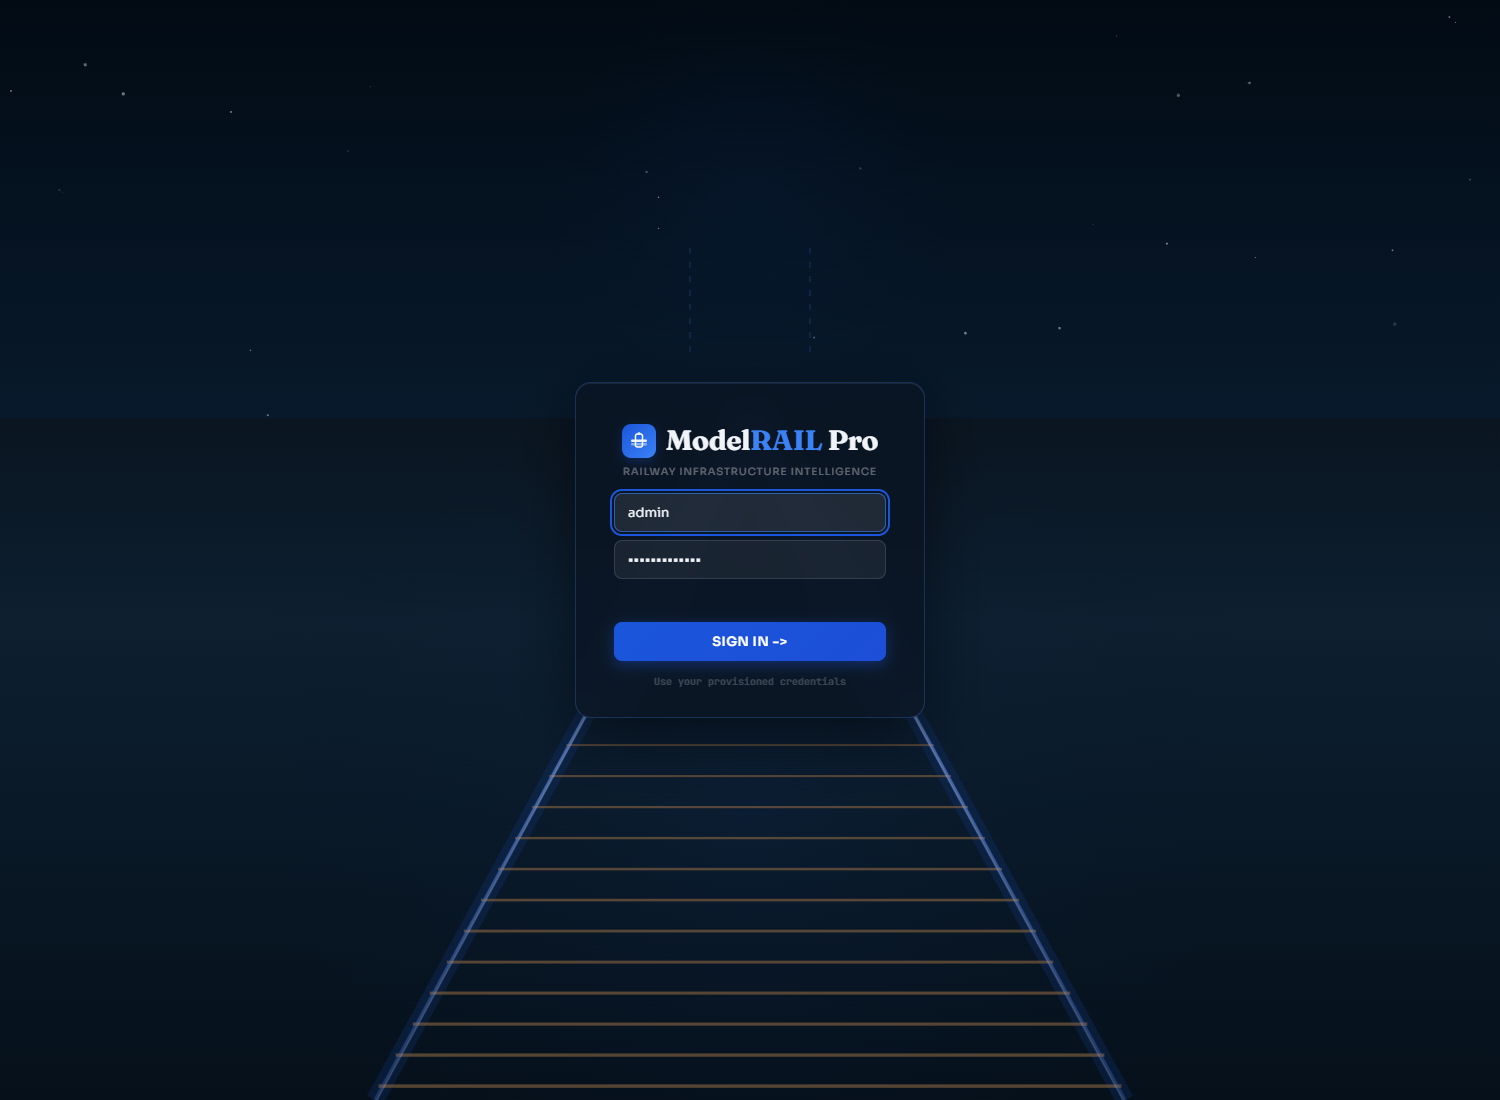
ModelRAIL Pro
Rail infrastructure monitoring with GIS, InSAR, UAV workflows, point-cloud review, digital twin views, audit logging, reports, and live operational context.
Node.jsCesiumMapboxInSAR
05 The method
From muddy data to a reviewable decision surface.
Every engagement follows the same four-beat loop. Hover a node to see what it actually means on the ground.
-
01
Discover
Map the hazard, the stakeholder, and the decision. Audit the data you actually have — DEM, SAR stacks, orthos, BIM, IoT feeds, ground-truth.
- Stakeholder interviews
- Data inventory & gap analysis
- Decision-surface sketch
-
02
Model
Build the analytical spine — PCA vulnerability, PSI/SBAS deformation, segmentation networks, multi-hazard PostGIS schemas — with reproducible notebooks.
- Geoprocessing pipelines
- GeoAI training & benchmarks
- Validation vs ground-truth
-
03
Interface
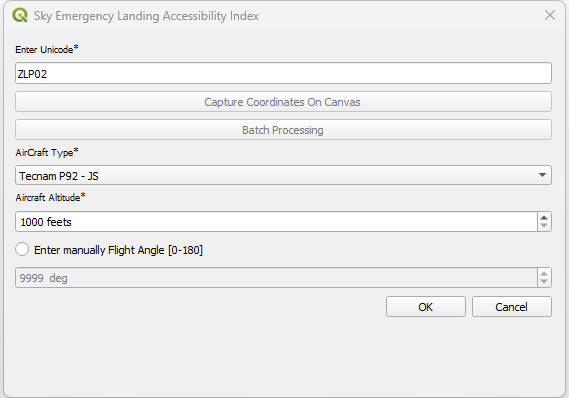
Wrap the model in a surface someone can actually defend in a meeting — WebGIS, plugin dialog, digital-twin viewer, or dashboard with real filters.
- Mapbox / Cesium / QGIS UI
- Accessibility & review flow
- Export / report generator
-
04
Evidence
Ship an audit-ready bundle — screenshots, data dictionaries, versioned notebooks, and a short Loom walkthrough. Nothing lives in a lone laptop.
- Evidence manifest
- Handover & training
- Post-delivery review
“Daud’s work bridges academic rigor and ship-ready product craft in a way most geospatial engineers never reach. The digital-twin prototype was usable in the same week we briefed it.”
06 The work
Shipped systems & client deliveries.
Seven verified client deliveries — published research, WebGIS tooling, dashboards, plugins, and hazard analytics. Click a card to open the case-study gallery.
Published · Scientific Reports (Nature)
Urban building-footprint segmentation
DeepLabv3 + U-Net + RGB+Z fusion for high-resolution ortho-imagery. Five architectures benchmarked, camera-ready figures, co-authored journal paper.
- 5models benched
- RGB+Zdata fusion
- 15case images
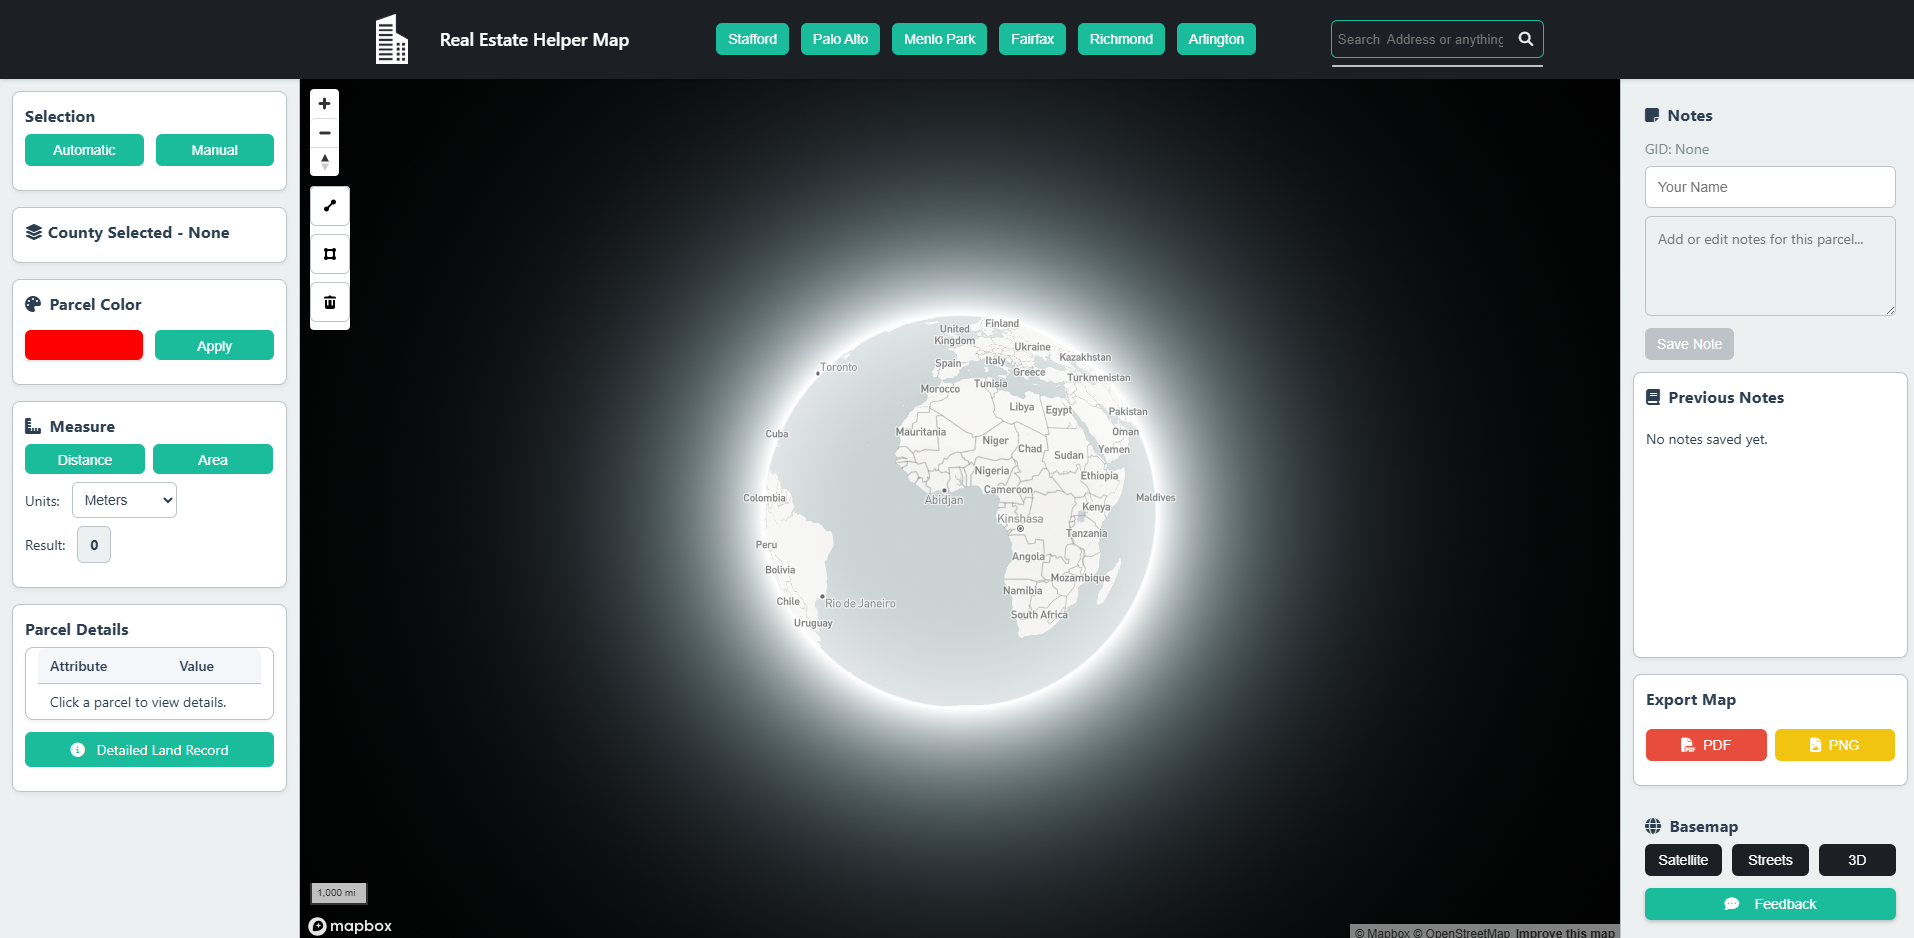
Mapbox GL · WebGIS
Mapbox real-estate parcel WebGIS
Browser-native parcel review surface — custom basemap, polygon-draw selection, attribute filters, and CSV / KML export for a real-estate client.
- Polygondraw selection
- CSV+KMLexports
- 2case images
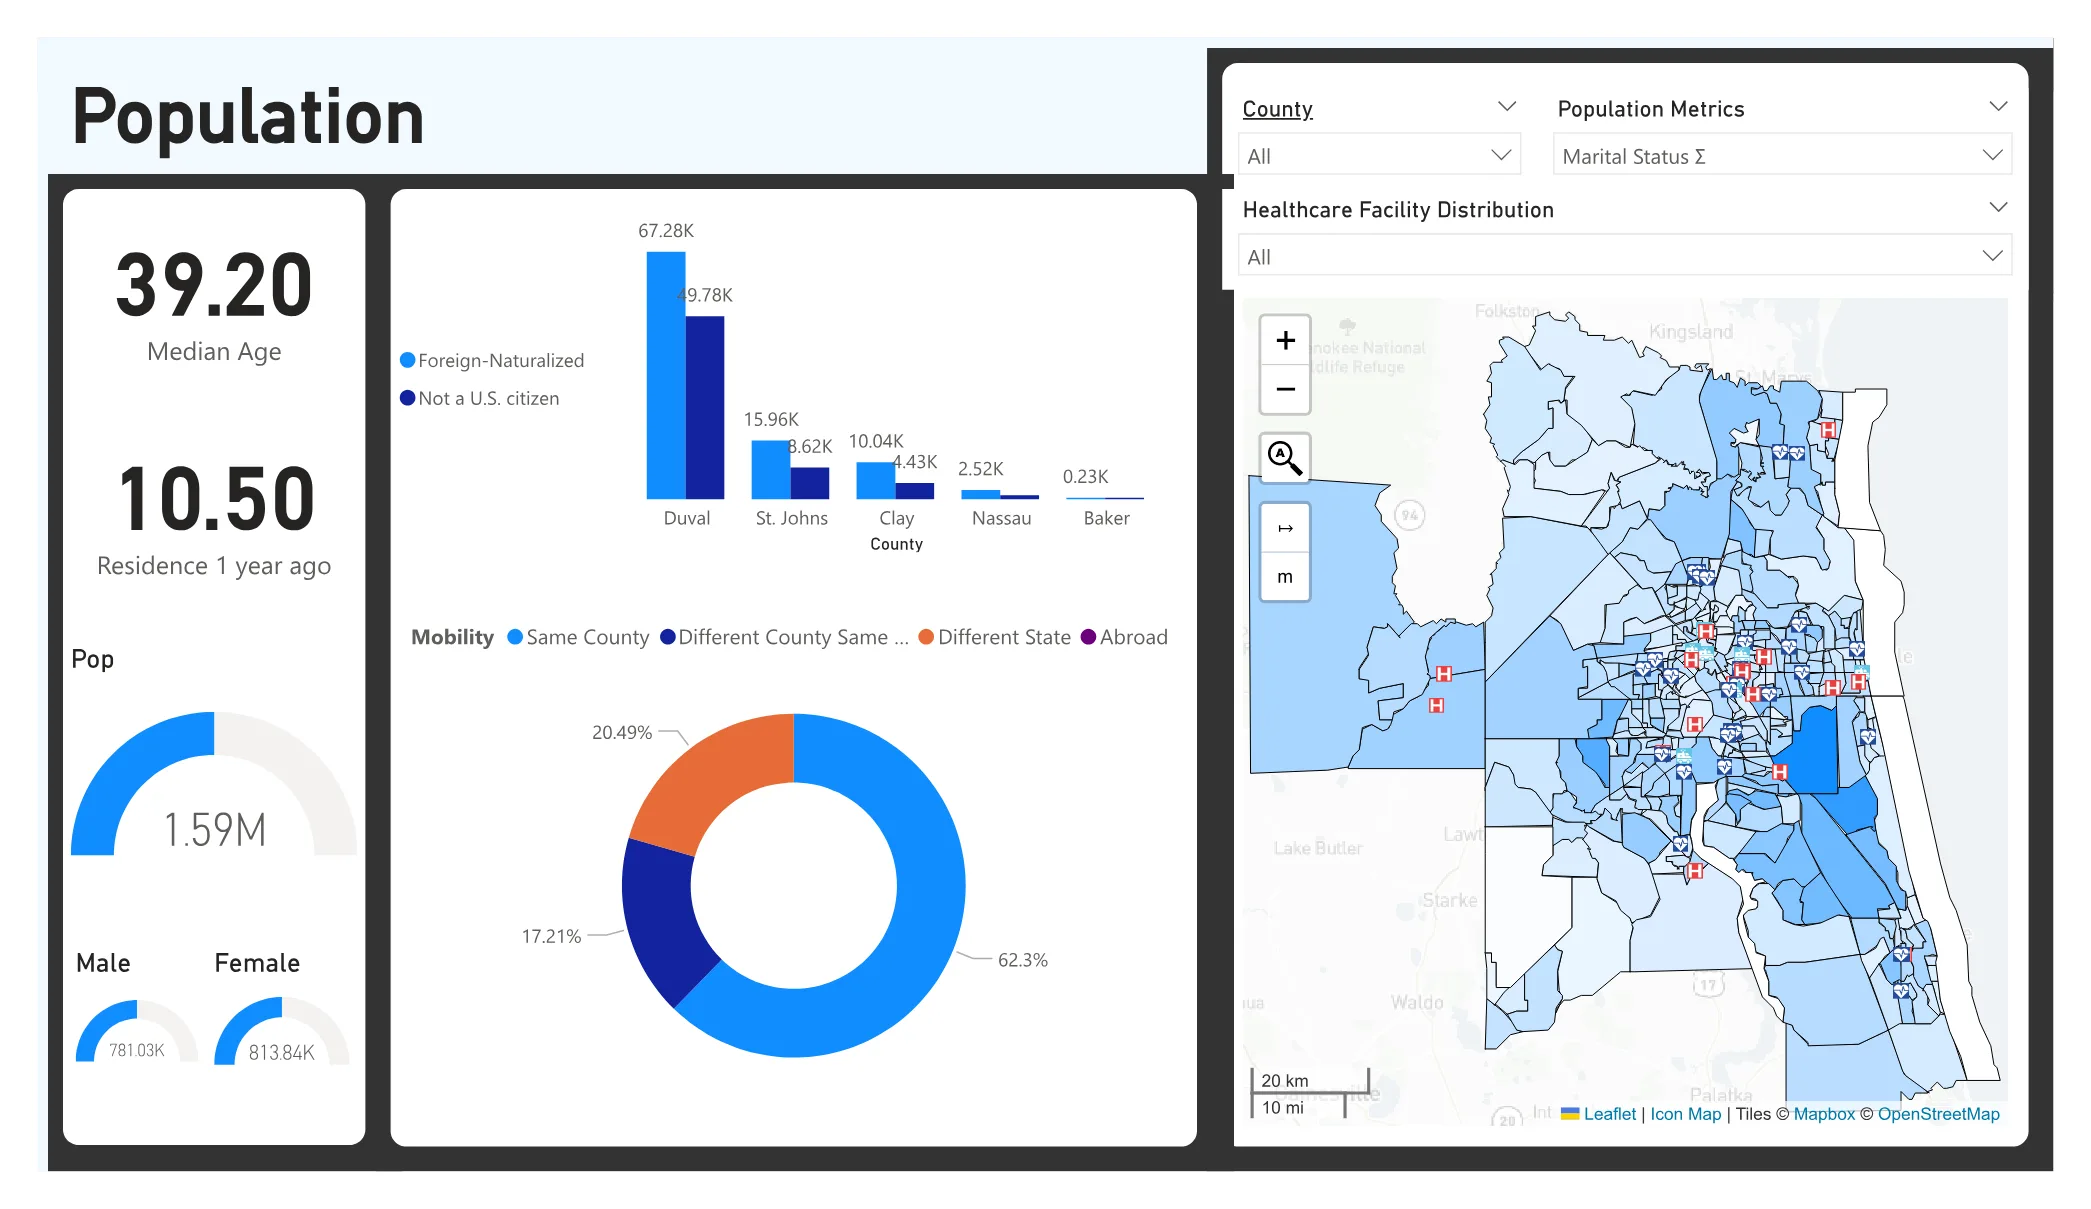
PowerBI · Market study
Jacksonville FL MSA dashboard
Eight-page PowerBI report for the Jacksonville Metropolitan Statistical Area — spatial joins, demographic overlays, and KPI rollups for a US market-study client.
- 8report pages
- Spatialjoins
- MSAscoped
QGIS · Client plugin
Cross-border highway SPO plugin
PyQGIS plugin enforcing EU cross-border highway Special Planning Object guidelines — geometry validation, topology checks, and audit-ready report export.
- Autogeometry check
- PDFreport export
- EUguideline ref
Published · Sustainability (MDPI)
Multi-hazard risk assessment
Multi-hazard susceptibility, exposure, and vulnerability modelling — flood, landslide, seismic — synthesised into a risk index for sustainable infrastructure planning.
- 3hazards modelled
- PCArisk index
- 9figure pages
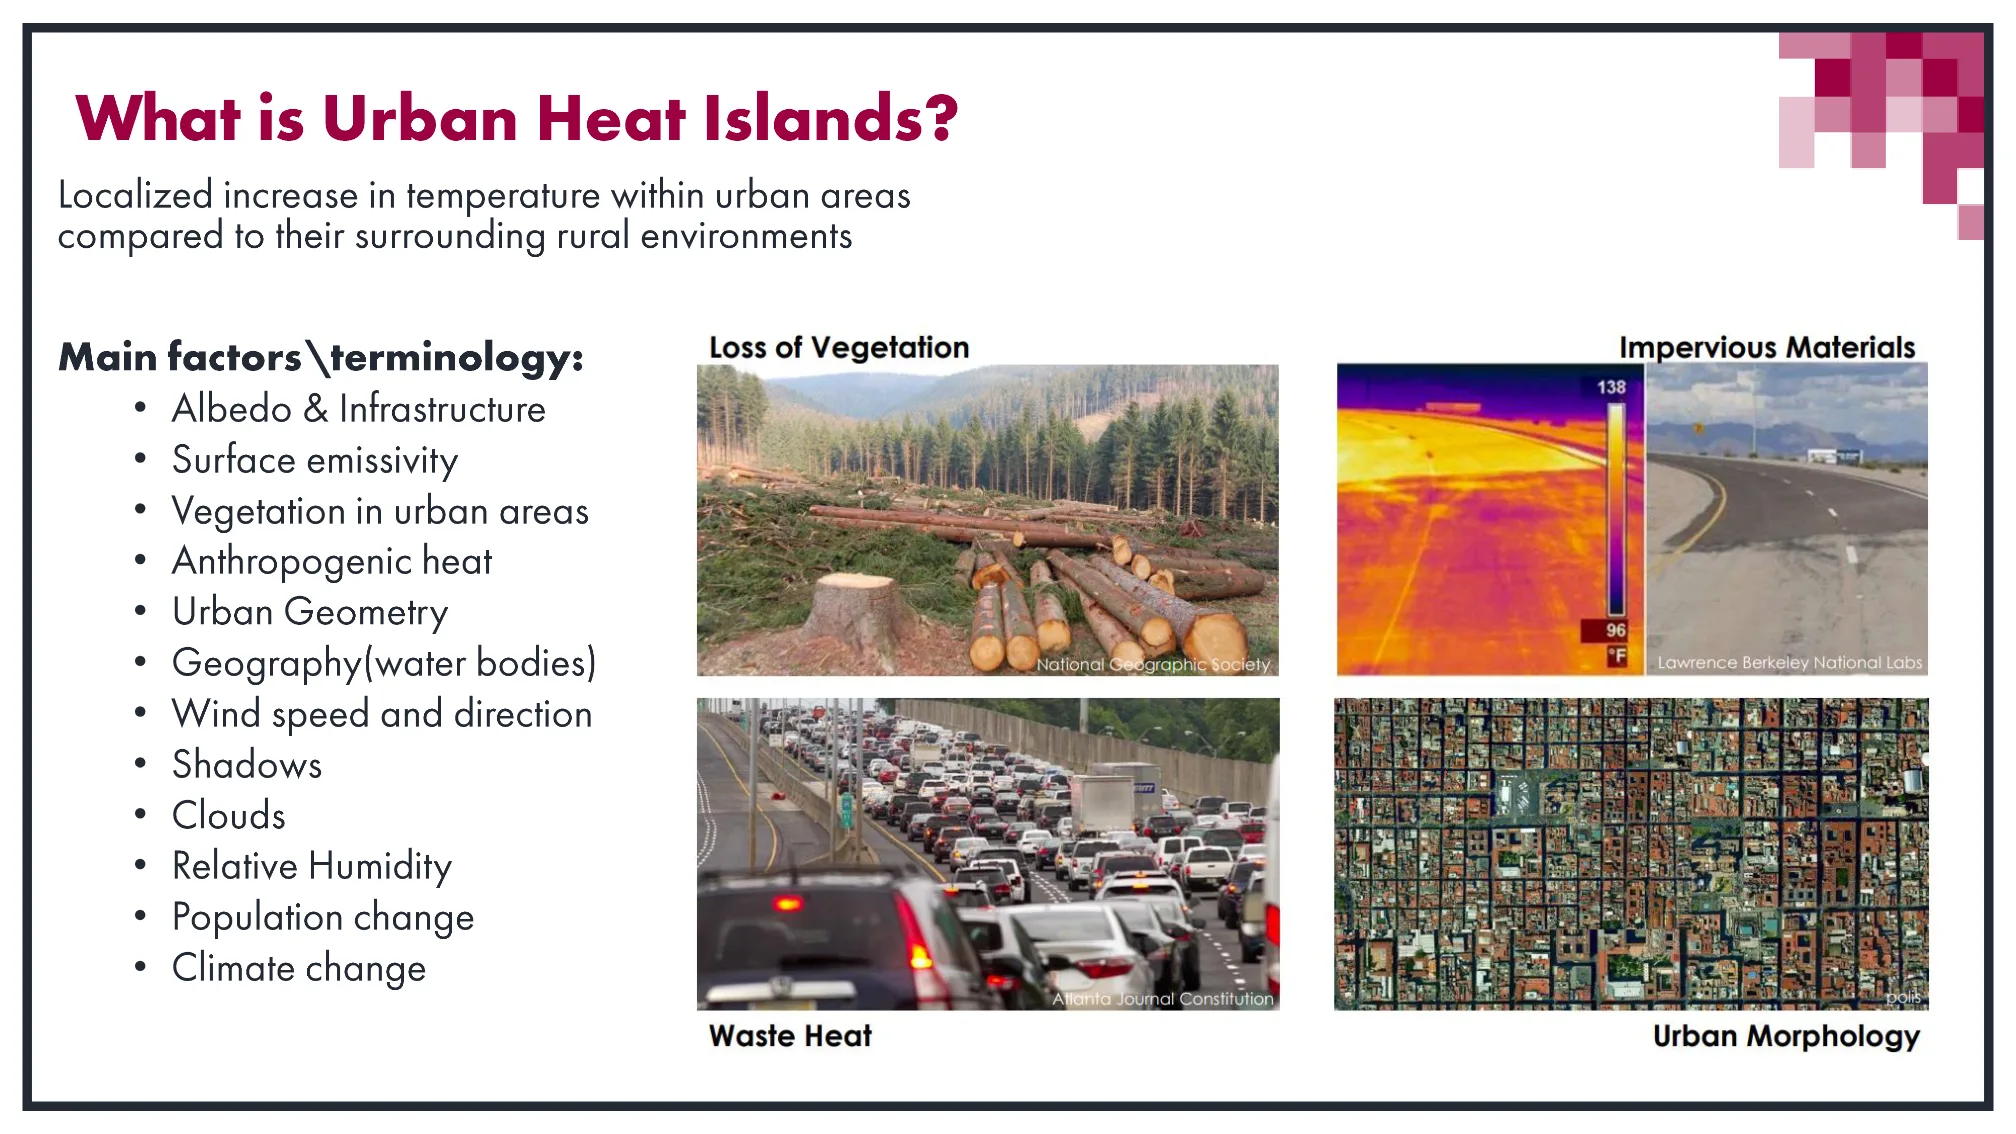
Urban climate · UHI
Urban Heat Island vulnerability
LST, NDVI, and adaptive-capacity analysis for an urban heat-island study summary — Landsat-derived rasters, PCA-driven vulnerability index, and map deliverables.
- Landsat 8LST rasters
- PCAadaptive index
- 6case pages
Hydrology · 44-page report
Watershed hydrology & morphometry
DEM-driven watershed delineation, morphometric indices, and hydrological response modelling — packaged as a 44-page audit-ready engineering report.
- 12morphometric idx
- 44page report
- 12case pages
07 The stack
Map, model, interface, evidence.
08 The collaboration
Need a geospatial system that feels real enough to review?
Best fit: WebGIS products, natural-hazard platforms, GeoAI demos, SAR/InSAR workflows, QGIS tooling, and digital-twin prototypes.